
Map the starting point
Inventory the pages, links, buttons, forms, and paths available in the app open in Chrome.
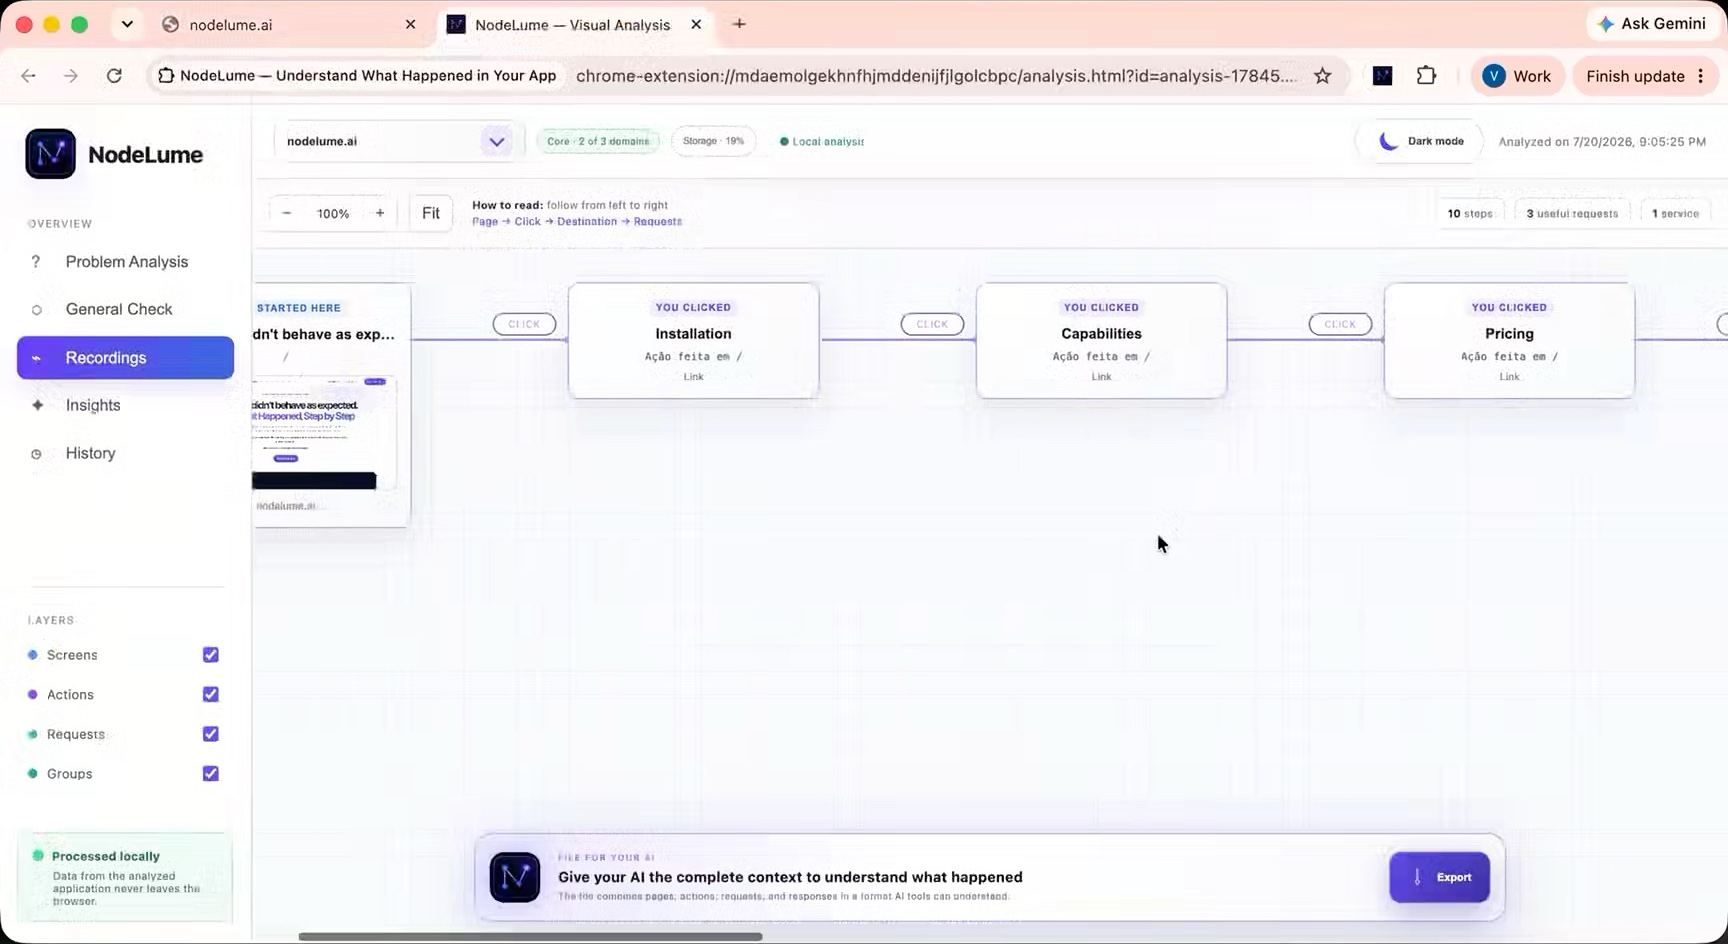
NodeLume correlates clicks, page changes, browser events, and network requests in one local visual timeline, giving you and an AI coding assistant concrete evidence to diagnose the issue.
No debugging experience required. No raw logs or complex developer tools. Capture data stays in your browser.
NodeLume — Debug what AI built.
Use NodeLume free without an account, login, or subscription: unlimited site analyses, 3 recordings, and 3 problem analyses. Sign in only to subscribe to Core or manage a paid plan.
Instead of comparing a screen recording with a separate Network panel, NodeLume keeps the user journey and technical signals on the same timeline.
Inventory the pages, links, buttons, forms, and paths available in the app open in Chrome.
Reproduce the issue normally while NodeLume aligns UI actions, page changes, events, and requests.
See the exact action, request, or event immediately before the flow changed, stopped, or returned an unexpected result.
Install NodeLume and start with the free usage included in the extension. There is no desktop app, server setup, account, or subscription required.
Add the NodeLume extension to Chrome and pin it for quick access while you work in a web app.
Open the extension and use the included free analyses. No login or subscription is required.
Keep using NodeLume free without an account, login, or subscription, or subscribe to Core for higher limits. Paid subscriptions are charged immediately.
Open your app, start recording, reproduce the real journey, and inspect the result directly in Chrome.
Each capture keeps the useful layers connected so you can move from the visible symptom to a likely cause.
See pages, buttons, menus, forms, and paths as a simple visual map.
Keep UI actions, page changes, browser events, and requests in the sequence they occurred.
Identify successful, failed, repeated, or slow requests without reading raw browser logs.
Surface slow steps, hidden failures, and third-party services that may explain the result.
Reopen earlier maps and recordings, keep useful captures, and delete the rest.
Share a structured visual record with an AI coding assistant instead of retelling the issue from memory.
NodeLume has no analysis backend, telemetry pipeline, or cloud sync. Captures are processed and stored in the Chrome extension. Full network recording is opt-in, limited to the recorded tab, and protected by explicit permissions.
Read the privacy details →Use NodeLume free without an account, login, or subscription. Core adds higher limits with regional monthly or yearly billing.
Prices are shown for your region. Paddle charges the selected price immediately when you subscribe. The highlighted yearly price is available for a limited time. See our Refund Policy and Terms of Use.
Yearly price available for a limited time. Paddle charges the selected regional price immediately. Free usage remains available without an account, login, or subscription.
Map up to three apps, record real browser journeys, and inspect UI actions, events, and requests in one local timeline.
Tell us what you are building or what you would like to understand. Your message will be sent directly to NodeLume at hello@nodelume.ai.
No. NodeLume presents the browser journey as a visual sequence that is easier to inspect and explain.
No. App analysis stays in local Chrome extension storage and is not uploaded to NodeLume.
The instant map inventories the visible pages and controls. A recording follows the path you take and aligns each action with the resulting page change, event, and request.
The capture provides concrete, ordered evidence about the user flow and browser activity, so the assistant can reason from more than a screenshot or error message.